The recovery that only shows up in a rolling view
The first half of 2026 closed with 104 detached single family homes sold across the 92130 zip code, and the median among them reached $2,708,000. That figure is up 5.6% from the first half of 2025 and up 12.5% from the second half of 2025. Price per square foot climbed to $875. The median home spent 10 days on the market before going under contract.
Those are the numbers. The reason they matter is the shape of the path that produced them, and that shape is invisible in the way most people read this market. The standard mid year update quotes one month against the same month a year earlier. It is clean and seasonally honest, but in a zip code where fifteen to thirty detached homes close in a typical month, a single month's median rests on too few transactions to be stable. Group the sales into rolling six month halves instead, and a pattern emerges that no month over month comparison surfaces: Carmel Valley's detached market softened materially in the back half of 2025, found a floor, and turned upward in the first half of 2026.
This is a recap of that turn, built from proprietary MLS data rather than an aggregator's blended estimate, and dated by close of escrow rather than list date. It covers three and a half years so the current moment has context.
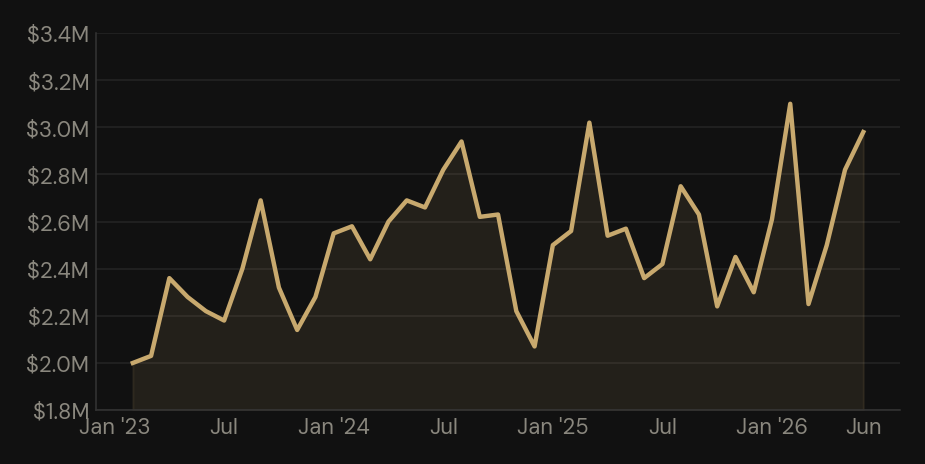
The faint line is the monthly median, which swings sharply on small sample sizes. The bold bars are the six month average, the steadier read of the trend. Axis begins at $1.8M for legibility, and January 2023, a single $8.18M closing, is excluded.
The trough nobody announced
Read month by month, late 2025 looked unremarkable. August closed at a $2.75M median, September at $2.63M, and no single month screamed weakness. But group July through December 2025 as one cohort of 104 sales and the softness becomes unmistakable. The rolling median for that half was $2,407,500, the lowest of any six month window in this dataset since the first half of 2023. More telling than price was speed: the median home took 26 days to go under contract, more than double the pace of the surrounding periods, and the median sale closed at 97.8% of its asking price. That last figure matters because it is the only rolling half in three years where the typical Carmel Valley home sold for measurably less than its list price.
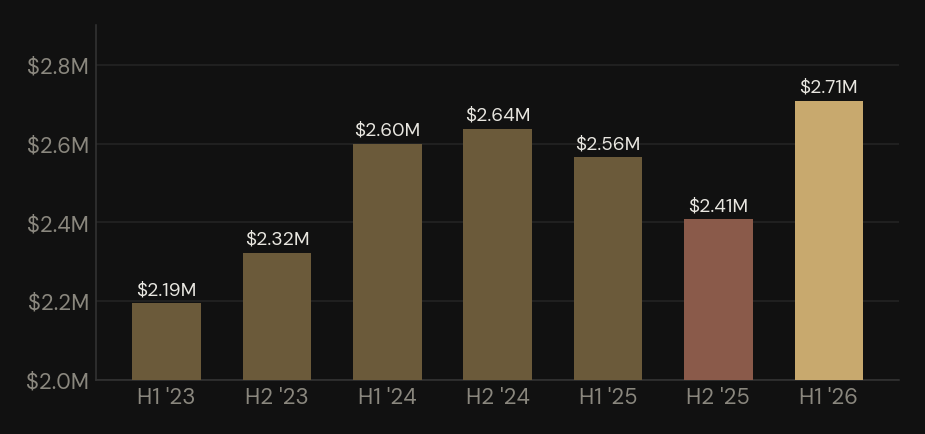
The second half of 2025, highlighted, is the softest rolling half since early 2023. The first half of 2026 is the strongest in the series.
The reason this trough never made a headline is structural. Each individual month of the second half of 2025 was compared against its counterpart in 2024, and because 2024 had its own uneven months, the year over year comparisons canceled out into noise. Only the aggregate revealed the floor. This is the central lesson of the half, and it is a methodological one: in a thin market, the rolling view is not a nicety. It is the only view that tells the truth.
The turn
The first half of 2026 broke cleanly from that floor. The rolling median rose to $2,708,000, a 12.5% gain over the immediately preceding half and a 5.6% gain over the first half of 2025. Price per square foot recovered from $808 to $875, an 8.3% move. But the sharpest signal was again speed rather than price.
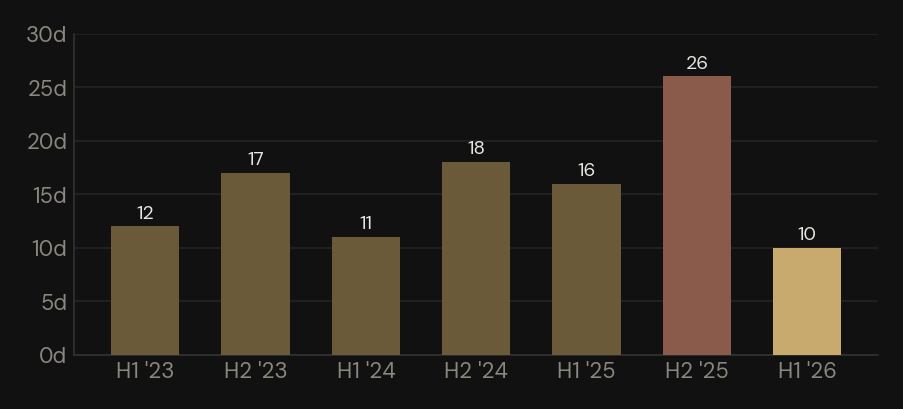
A lower number means homes went under contract faster. The first half of 2026 is the fastest rolling half in the available data.
Days on market compressed from a median of 26 in the second half of 2025 to 10 in the first half of 2026. A ten day median across a full six months means the typical detached listing in 92130 was in escrow inside two weeks. That is not a drifting market absorbing inventory slowly. It is a market where correctly priced homes leave the board almost immediately, and it represents the fastest rolling half in this entire dataset. Nothing resets buyer psychology faster than watching homes disappear in days, and buyers who waited out the softer autumn returned in the new year to a board that had tightened underneath them.
Where the money went
The 104 sales did not distribute evenly across price points. They clustered in a barbell shape that says a great deal about who is buying in Carmel Valley right now.
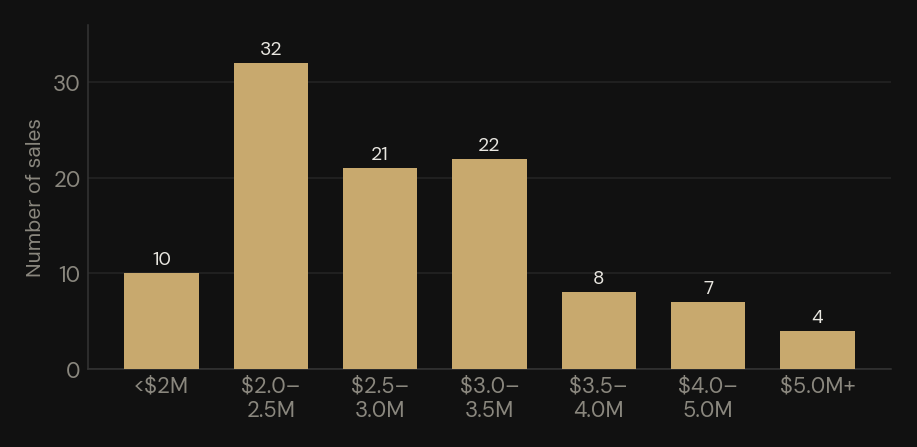
The largest single group, 32 of the 104 sales, landed between $2.0M and $2.5M, the entry band for detached ownership in this zip code. Above that, the $2.5M to $3.5M range absorbed another 43 sales, and the top end stayed genuinely active, with eleven homes closing above $4M and four above $5M. The single largest sale of the half was a 12,028 square foot estate on Rancho Del Mar Trail at $8.58M, which went under contract in 20 days. The floor of the market held too: the lowest detached closing was $1.28M. What thins out is the exact middle, which is characteristic of a market split between move up families competing for the entry tier and a smaller, less price sensitive luxury pool at the top.
Segmenting by size sharpens the picture further.
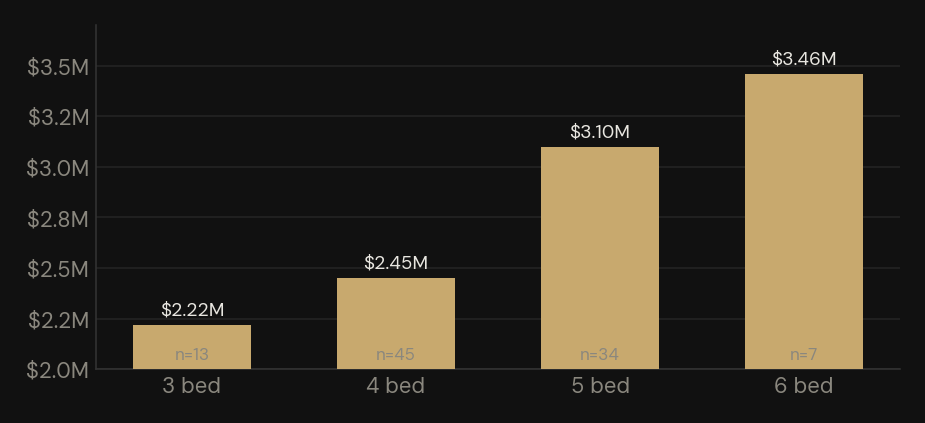
Four bedroom homes were the most common size sold at 45 of 104 closings. Two and seven bedroom counts are omitted for small sample.
Four bedroom homes were the workhorse of the half, 45 of the 104 sales, at a $2.45M median. Five bedroom homes, 34 sales, carried a $3.10M median. The premium for the fifth bedroom is real and steep, roughly $650,000, which reflects how much of Carmel Valley's demand comes from families sizing up rather than first time buyers sizing in. Notably, price per square foot runs inverse to size at the top: the largest homes carry lower per foot pricing, because buyers at $3.5M and up are paying for land, lot position, and total space rather than marginal square footage.
Pricing discipline held the whole way
Across the first half of 2026, the median sale to list ratio was exactly 1.00. The typical Carmel Valley home sold for precisely its asking price, neither above nor below. That single number conceals a more textured reality underneath. In June, 44% of detached sales closed above asking and 48% below, with the median landing exactly at list. Roughly half of all homes in the half sold below their original list price at some point in their listing life, meaning price reductions were common even as final clearing stayed at fair value.
A market clearing at fair value is the healthiest state a market can occupy, and the hardest to read from a headline. It is not euphoric, with bidding wars on every home, nor is it capitulating, with sellers giving ground across the board. A seller who prices correctly on day one participates in the ten day median. A seller who prices on hope joins the half of the market that cut before selling.
Real appreciation, not a change in the mix
A fair question about any median is whether it moved because values rose or simply because larger homes happened to sell. Here the data separates the two cleanly. Median home size was essentially flat between the halves, roughly 3,140 square feet in the second half of 2025 and 3,170 in the first half of 2026, a difference of about one percent. Over the same stretch, median price per square foot rose from $808 to $875, a gain of 8.3 percent. Because size held steady while the per foot figure climbed, the recovery reflects real appreciation rather than a shift in the mix of homes changing hands.
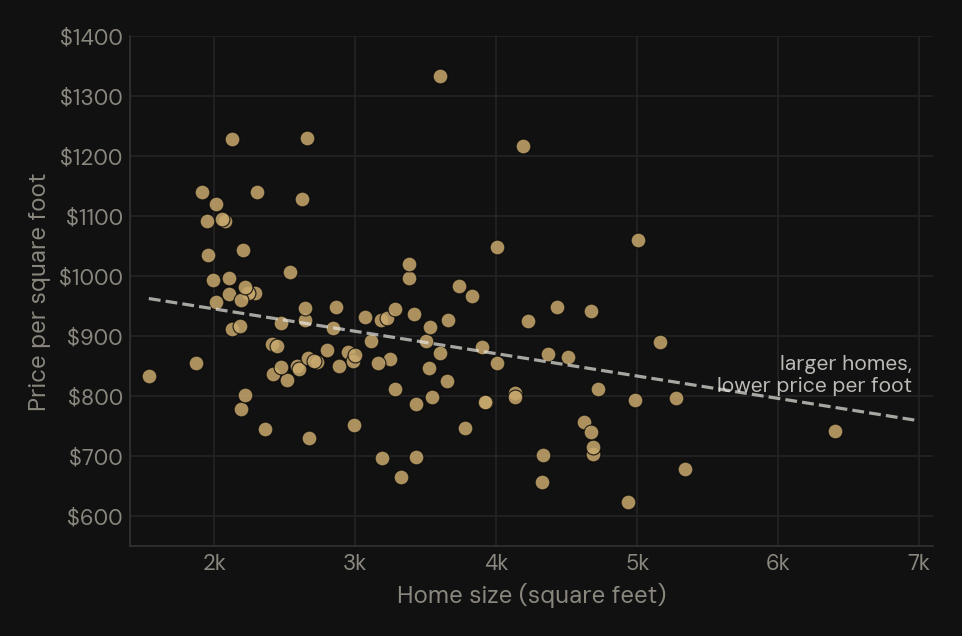
Each point is one sale. The dashed line shows the trend: larger homes tend to sell at a lower price per square foot, since buyers above roughly 4,000 square feet are paying for land and total space rather than marginal footage. Two homes above 7,000 square feet are omitted from view for scale.
The scatter also answers a related question about how size and value interact. Larger homes carry a lower price per square foot, a mild but clear relationship. A buyer comparing a 2,500 square foot home against a 4,500 square foot one is not simply buying more space at the same rate, but paying a declining rate per foot as size climbs. That is why price per square foot is most useful when comparing homes of similar size, and why a single zip wide figure can only ever be a starting point.
Volume tells the same story. The first half of 2026 saw 104 detached homes close, the same count as the second half of 2025, so the higher median came from homes selling at higher prices rather than from a thinner pool of sales.
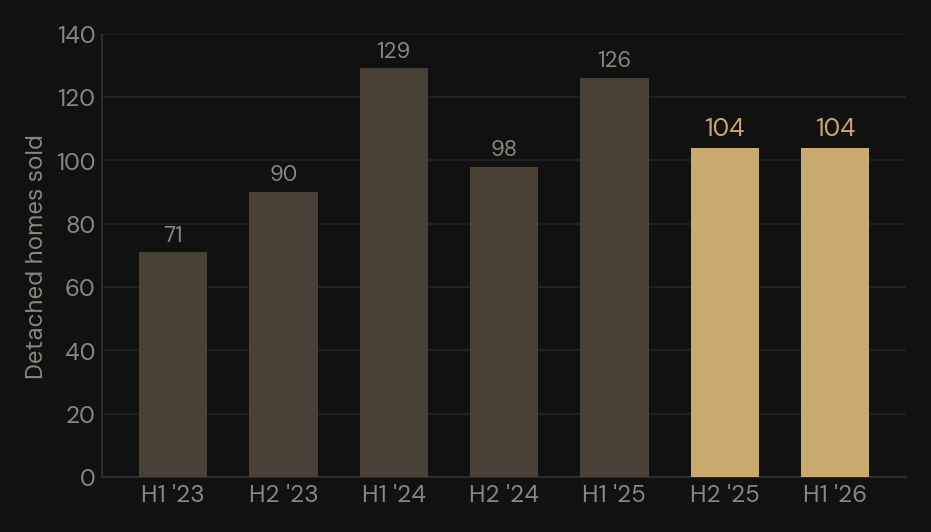
Volume has run between roughly 70 and 130 closings per half. Activity in the first half of 2026 was steady against late 2025, and modestly below the 126 sales of the first half of 2025.
That last point is worth stating plainly. First half activity is down somewhat from a year earlier, but it held level through the price recovery, which is the signal that matters. The market absorbed higher prices without a drop in transactions.
What this means if you are transacting
For sellers, the recovery is real but conditional. Homes are clearing at list, not above it, and the ten day median belongs specifically to homes priced right at launch. The market rewards accuracy, not optimism, and the penalty for overpricing is not a lower final price so much as a longer, reduction laden path to the same place.
For buyers, the window that opened in the second half of 2025 has largely closed. The softer pricing and the patient 26 day board are gone. What remains is a fast market clearing at fair value, which shifts the advantage toward being genuinely ready to act over being able to negotiate on price. Financing pre approval, a clear price range, and the ability to move on a home within its first week are worth more in this environment than the expectation of a discount.
A note on method
The Realtor.com dashboard elsewhere on this site tracks all property types on a monthly basis, and it is the right tool for a quick cross zip read across San Diego County. This analysis is a different instrument. It covers only detached single family homes, dated by close of escrow, drawn directly from the MLS rather than from an aggregator's estimated blend. That distinction is what made the second half of 2025 trough visible at all. The two data sources rarely disagree on direction, but only the granular, transaction level view could surface a six month floor that every month over month comparison smoothed away.
I look at this market every day from both sides, as someone who trades fixed income professionally and as a Carmel Valley resident and Realtor. If you want the same analysis run on a specific street, price point, or home size, I am happy to do it.