Two weeks ago the story was cooling inflation pulling rates down. Last week it was a fiscal and geopolitical selloff pushing them back up. This week the Fed stepped into the middle of that argument, held rates steady on a divided vote, and the bond market did not take it as reassurance. Long dated Treasury yields pushed to a 19 year high and kept climbing into Friday, mortgage rates sat at a fresh 12 month high, and a batch of Thursday data landed that complicates the picture rather than clarifying it. Here is what moved and how it reads in Carmel Valley.
The economic data
The Fed held the federal funds rate at 3.50% to 3.75% on Wednesday, its fifth consecutive hold. What made this meeting different was the dissent. Three regional presidents, Beth Hammack of Cleveland, Neel Kashkari of Minneapolis, and Lorie Logan of Dallas, voted to raise rates by a quarter point immediately. This is the first time since 2016 that three policymakers have dissented in the same hawkish direction. Chair Kevin Warsh has described inflation as a choice and stressed the committee will act quickly if price pressures accelerate. A hold that arrives with three votes for a hike is not a dovish hold, and the bond market read it exactly that way.
The reaction was in the long end of the curve, and it did not stop when the meeting ended. The 30 year Treasury yield jumped more than 10 basis points on Wednesday, then kept climbing through the rest of the week to close Friday around 5.23%, its highest level in 19 years. The 10 year, which mortgage rates actually track, rose to roughly 4.69%, its highest since January 2025. The 2 year, most sensitive to Fed policy, fell slightly. When the short end drops and the long end surges, that is a market demanding more compensation to hold longer dated debt, a term premium move driven by fiscal and inflation concerns rather than an expectation of imminent Fed action. As someone who trades fixed income for a living, that is the tell I watch. This was not the market pricing rate cuts. It was the market pricing risk.
Two forces kept the pressure on into Friday. Markets now put the odds of a quarter point hike at the September meeting near 63%, down from roughly 80% before Wednesday, but still high enough that traders are treating a hold as a postponement rather than a resolution. And the geopolitical premium has not eased: fresh US strikes on Iranian targets late in the week kept oil and risk sentiment elevated, the same pressure that has been lifting the long end since late February. Neither of those is something the Fed controls directly.
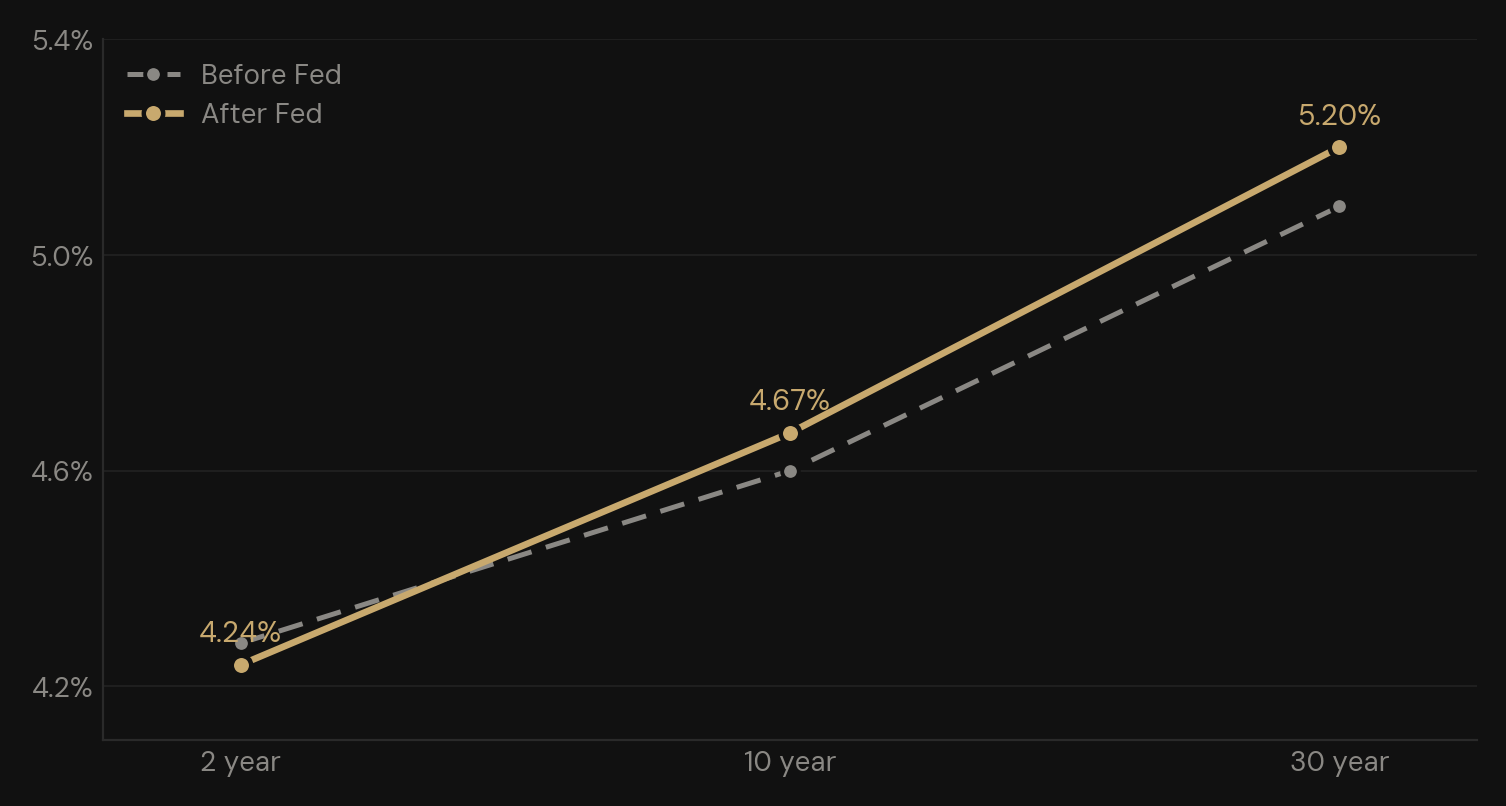
The short end fell while the long end surged and kept climbing into Friday, a classic term premium move. The 30 year Treasury reached its highest level in 19 years. Source: U.S. Treasury, CNBC, Trading Economics.
Mortgage rates went with it, up to a point. Freddie Mac reported the 30 year fixed rate at 6.66% for the week, up from 6.58%, the fourth straight weekly increase and the highest level since late July 2025. The 15 year fixed rose to 6.04%. A year ago the 30 year sat at 6.72%, so this is elevated but not unprecedented, and it remains far above the sub 6% readings from late February before oil and geopolitical pressure took hold.
Worth noting the divergence at week's end: while the 30 year Treasury kept climbing into Friday, daily mortgage quotes held roughly flat, with several lender surveys showing them a touch lower on the day. That gap does not usually last. Mortgage rates track the 10 year Treasury with a lag, so a long end that stays elevated tends to pull mortgages up behind it rather than the reverse. If anything, the fact that mortgages have not yet fully caught up to this week's move is a reason for a ready buyer to act now rather than wait for the gap to close the wrong way.
What that headline misses is the longer view. Step back three years and this week's rate is not an outlier, it is the middle of a band the 30 year has held since 2023. At 6.66% this week, the rate actually sits below where it stood a year ago and three years ago. The one meaningfully lower point in recent memory was this past January, when the 30 year briefly touched near 6%. That is the real reference point a buyer is measuring against, not some distant era of cheap money.
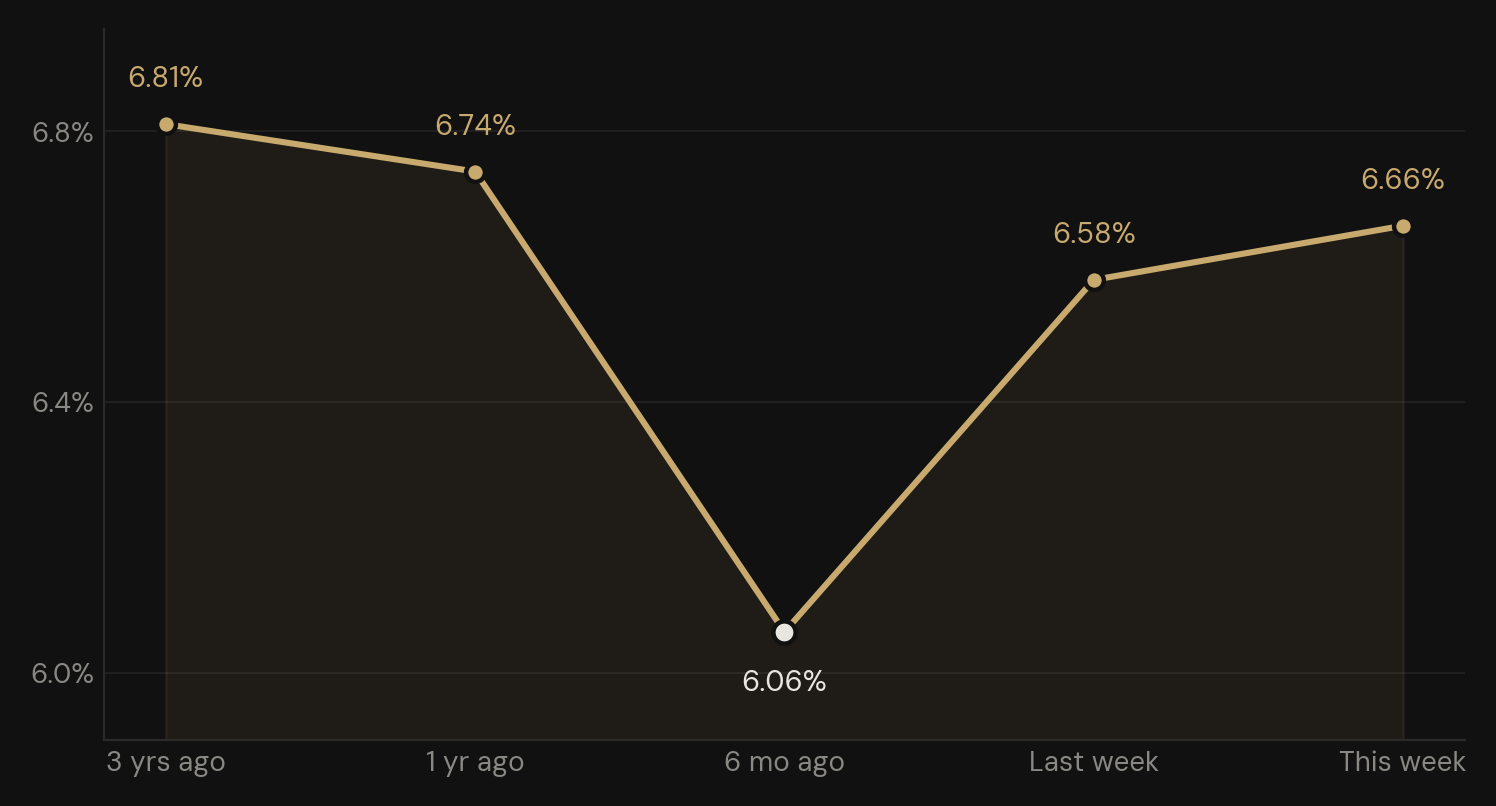
The 30 year fixed has held in the mid 6 percent range for three years. This week's 12 month high sits below where rates were a year and three years ago. The January 2026 low near 6 percent, highlighted, is the real recent reference point. Source: Freddie Mac Primary Mortgage Market Survey.
The clearest way to translate a rate move into a decision is to run the same loan across those points. Here is a $2 million home financed over 30 years at each rate, a price point closer to the average detached home in Carmel Valley than a round national figure. The full purchase price is financed here so the rate is doing all the work.
| When | Rate | Monthly payment | Interest over loan term | Total paid |
|---|---|---|---|---|
| 3 years ago | 6.81% | $13,052 | $2,698,658 | $4,698,658 |
| 1 year ago | 6.74% | $12,959 | $2,665,121 | $4,665,121 |
| 6 months ago | 6.06% | $12,068 | $2,344,577 | $4,344,577 |
| Last week | 6.58% | $12,747 | $2,588,836 | $4,588,836 |
| This week | 6.66% | $12,853 | $2,626,914 | $4,626,914 |
Principal and interest only, excluding taxes, insurance, HOA, and Mello-Roos. Rates are Freddie Mac weekly survey averages; an individual quote depends on credit, down payment, and loan type.
The spread tells the story. This week's payment runs about $106 a month above last week and roughly $200 above three years ago, real money over 30 years but not the kind of jump that changes whether a home is affordable. The larger gap is against January's dip: a buyer who locked near 6% then is paying close to $800 a month less than one financing the same home today. That is the number worth internalizing. The rate that matters for a decision right now is not a return to 2021, it is whether this week's level holds or drifts back toward the low 6s.
My own view, and I trade fixed income at LM Capital for a living, is that this range is closer to normal than the exception. The sub 3% era was a response to a global emergency, not a baseline anyone should plan around. Between structural federal deficits, inflation that has cooled but not cleared, and a term premium that has been rebuilding for two years, the forces holding the 30 year in the mid 6s look more durable than temporary. I would plan around a rate that starts with a 6, not wait for one that starts with a 3.
Thursday's data cut in several directions at once. Second quarter GDP came in at a 1.5% annualized pace, a miss against the 2.0% consensus and a slowdown from 2.1% in the first quarter. But the composition was healthier than the headline: consumer spending accelerated to 3.2%, and the miss was driven by volatile components, a surge in imports and a drop in government outlays. The inflation reading inside the report ran hot, with the GDP price index at 6.2%, even as core PCE within GDP eased to 3.4% from 4.4%. Separately, the June PCE deflator, the Fed's preferred inflation gauge, fell 0.1% for the month, with core PCE up just 0.1% and holding at 3.3% year over year. And the labor market stayed firm: initial jobless claims came in at 197,000 for the week ending July 25, below the 200,000 estimate, with the four week average near a multi decade low.
Put together, this is the setup that keeps the Fed boxed in. Growth is softening, but inflation has not resolved and the labor market is not cracking. That combination gives the hawks their argument and gives the long end of the bond market its reason to stay elevated. For a homebuyer, the practical translation is that the forces pushing mortgage rates up right now are largely outside the Fed's direct control and may not ease on the timeline many buyers are hoping for.
The week in numbers
- 30 year mortgage rate: 6.66%, a 12 month high, up from 6.58% the week before (Freddie Mac weekly)
- 30 year Treasury yield: about 5.23% at Friday's close, a 19 year high
- 10 year Treasury yield: roughly 4.69%, highest since January 2025
- Fed funds rate: held at 3.50% to 3.75% on a 9 to 3 vote, three dissents favoring a hike
- September hike odds: near 63%, down from roughly 80% before the meeting
- Q2 GDP: 1.5% annualized, below the 2.0% consensus, down from 2.1% in Q1
- Consumer spending: up 3.2% in Q2
- June core PCE: up 0.1% for the month, 3.3% year over year
- Initial jobless claims: 197,000, below the 200,000 estimate
What it means for Carmel Valley (92130)
The national headline this week is rates at a one year high on the back of a bond market selloff. That is exactly the kind of number that pulls buyers to the sidelines who are watching the macro rather than their own submarket. San Diego County closed June with a combined median residential price of $950,000, up 4.4% from a year earlier, with the detached median at $1.125 million, up 5.1%. Detached homes countywide are still selling in roughly two weeks. This is not a market rolling over in response to rate headlines.
The distinction that matters most for anyone weighing a move in 92130 is what actually drove this week's rate increase. A move built on a bond market term premium and a hawkish Fed is different from one built on a temporary inflation scare. The inflation scare tends to resolve as the data improves, which is part of why rates eased earlier in the month. A term premium move, where investors demand more yield to hold longer dated debt because of fiscal and policy risk, can persist longer, because it is not waiting on a single data print to reverse. Buyers holding out for rate relief may be waiting on a catalyst that is not close at hand.
I will have a detailed read on July activity in Carmel Valley in next week's edition, once the month closes and the local numbers are in.
The takeaway
For sellers, three weeks of rate volatility in both directions have not dented buyer demand countywide, which keeps the lesson exactly where it has been: price correctly at the outset, because pricing discipline is the lever that works regardless of what the 10 year does on any given day. For buyers, the honest read heading out of this Fed meeting is that the path to lower rates just got narrower, not wider. A committee with three members voting to hike, a 30 year Treasury at a 19 year high, and inflation that has cooled but not cleared is not a setup that argues for waiting. If a home fits, the rate you would get by waiting may not be meaningfully better.
I look at this market every day from both sides, as someone who trades fixed income professionally and as a Carmel Valley resident and Realtor. If you are weighing a move in Carmel Valley, Del Mar, Encinitas, or elsewhere across North County Coastal San Diego, I am happy to walk through what these numbers mean for your specific situation.