October was the month the balance of power in Carmel Valley shifted. Detached homes in 92130 sold for almost exactly what they did a year ago on a per square foot basis. But fewer of them sold, half of the sellers who closed had to cut their price first, and homes took a week longer to find a buyer. With the 30 year mortgage rate above 7% for the entire month, buyers who are still active are negotiating from a stronger position than they've had in a long time.
Here is what the MLS data shows, and what's driving it.
October in 92130 at a glance
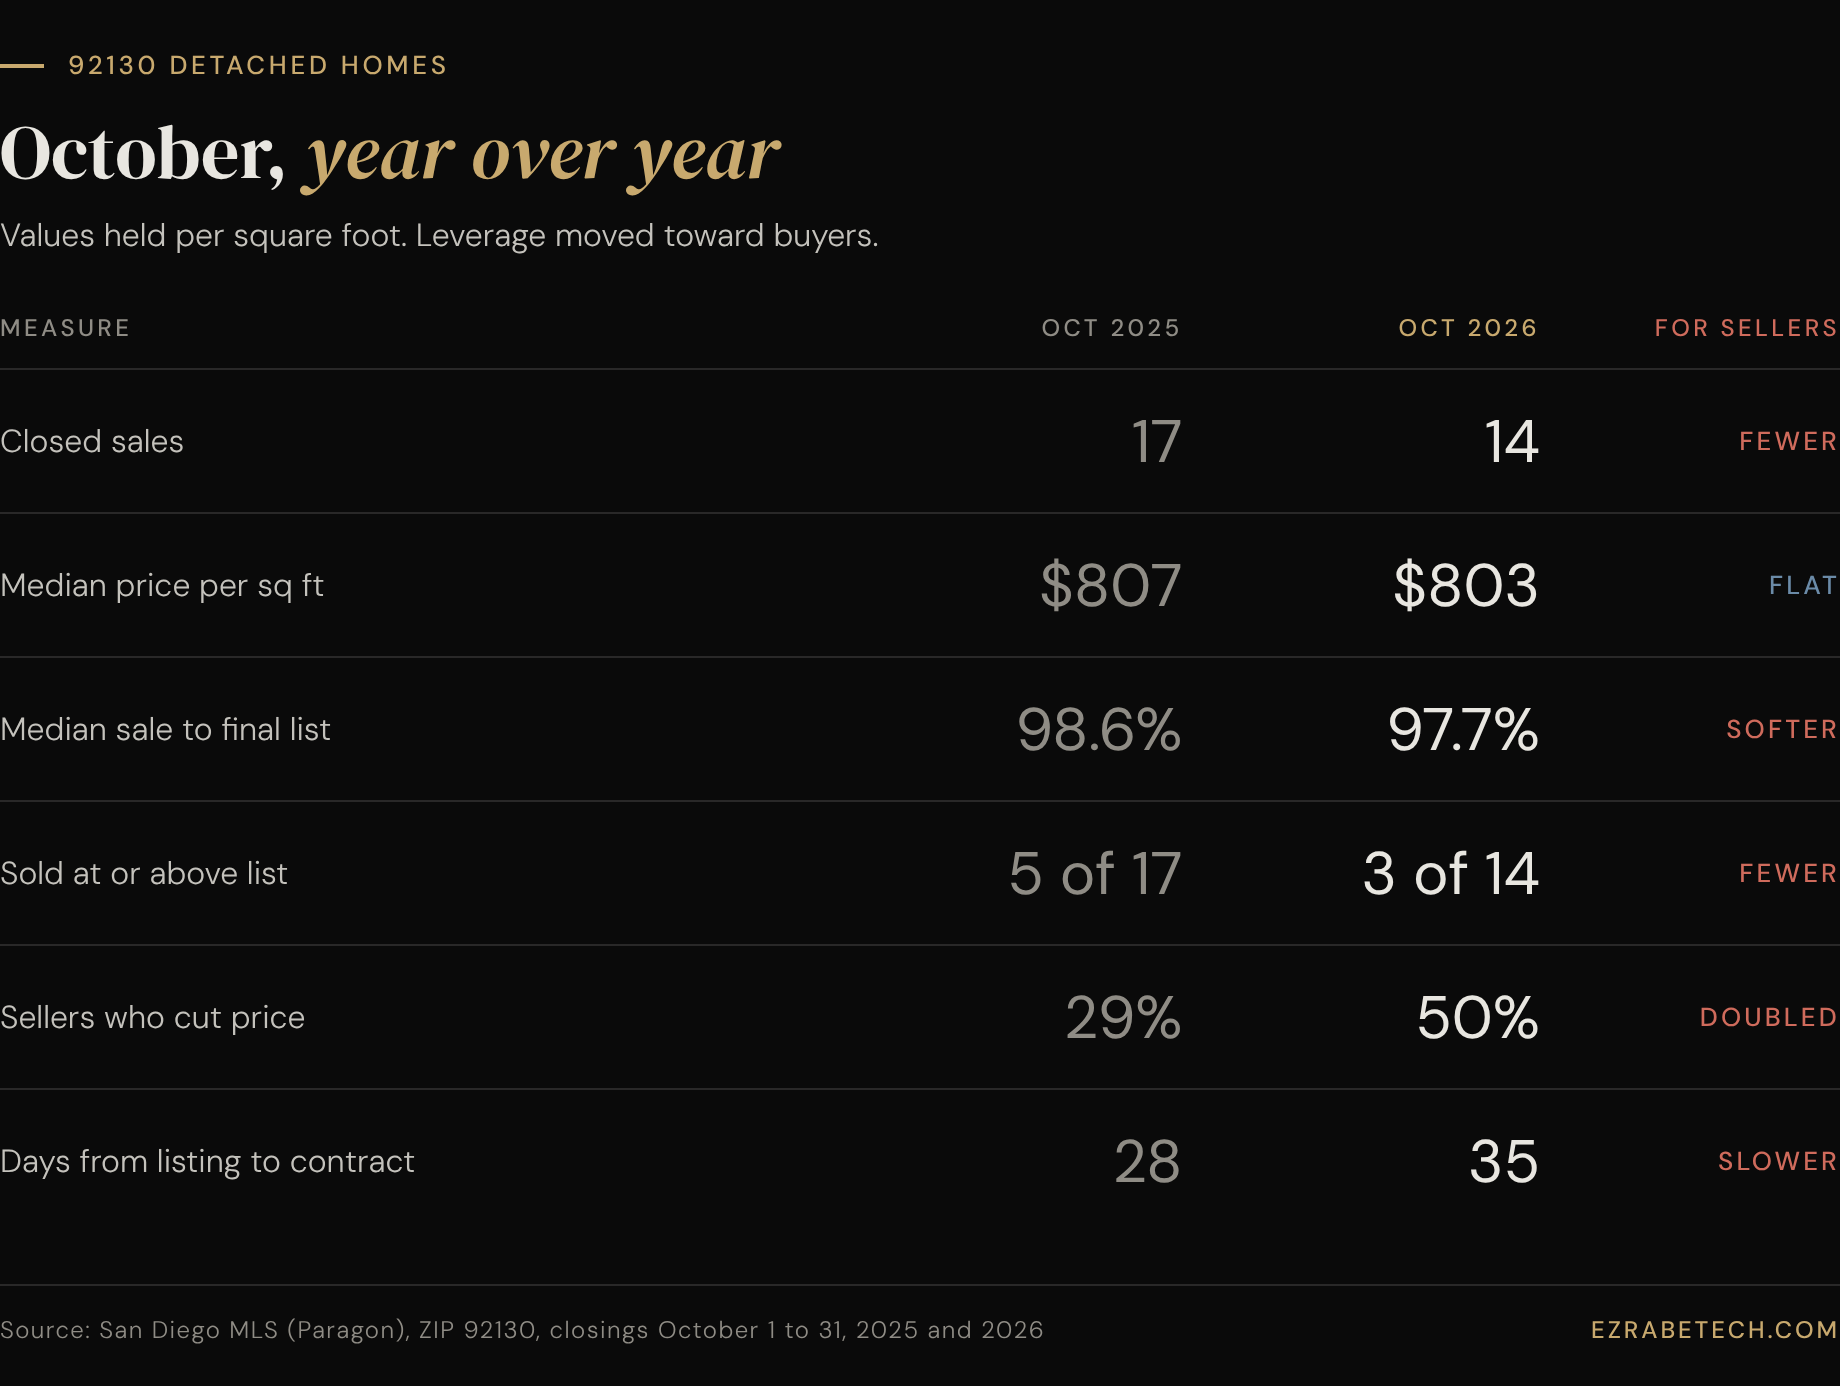
Every row but one moved in the buyer's favor. Price per square foot, the measure that controls for home size, held flat. Source: San Diego MLS (Paragon), detached homes closed in 92130, October 1 to 31 of each year.
Values are flat. The median price is misleading.
The headline number for October looks dramatic: the median detached sale was $2.86 million, up 28% from $2.24 million a year ago. That is not appreciation. October's sales simply skewed toward larger homes, with a median size of about 3,600 square feet compared with roughly 2,850 last October. Measured per square foot, which controls for size, values came in at $803 versus $807 a year ago. Effectively unchanged.
I lead with price per square foot because a small market like 92130, with 14 detached sales in a month, can swing its median by hundreds of thousands of dollars based on which homes happen to close. Anyone quoting a 28% gain is reading the mix, not the market.
Half the sellers cut their price
The more telling shift is in how homes got sold. Seven of October's 14 detached sales had at least one price reduction before going under contract, up from 29% of sales a year ago. Only three closed at or above their final list price. The median home sold at 97.7% of its final asking price and 96.2% of its original asking price.
Speed and price moved together. The six homes that went under contract within two weeks of listing sold at a median 97.5% of their original asking price, and only one of them had cut. The seven that sat past 30 days sold at a median 93.6% of original ask, and six of the seven reduced along the way.
12661 Monterey Cypress Way is a typical example. It listed September 24 at $3,295,000, was reduced to $3,150,000, and closed October 30 at $3,125,000, about 5% below where it started. That is a well located home that sold in five weeks, but only after the seller met the market.
The gap between asking and closing
The clearest signal in the data is the distance between what sellers are asking and what buyers are paying. In September's review I flagged the pending over active spread turning negative for the first time in three months. For detached homes as of October 31, it sits at negative $62 per square foot, and the closings landed lower still.
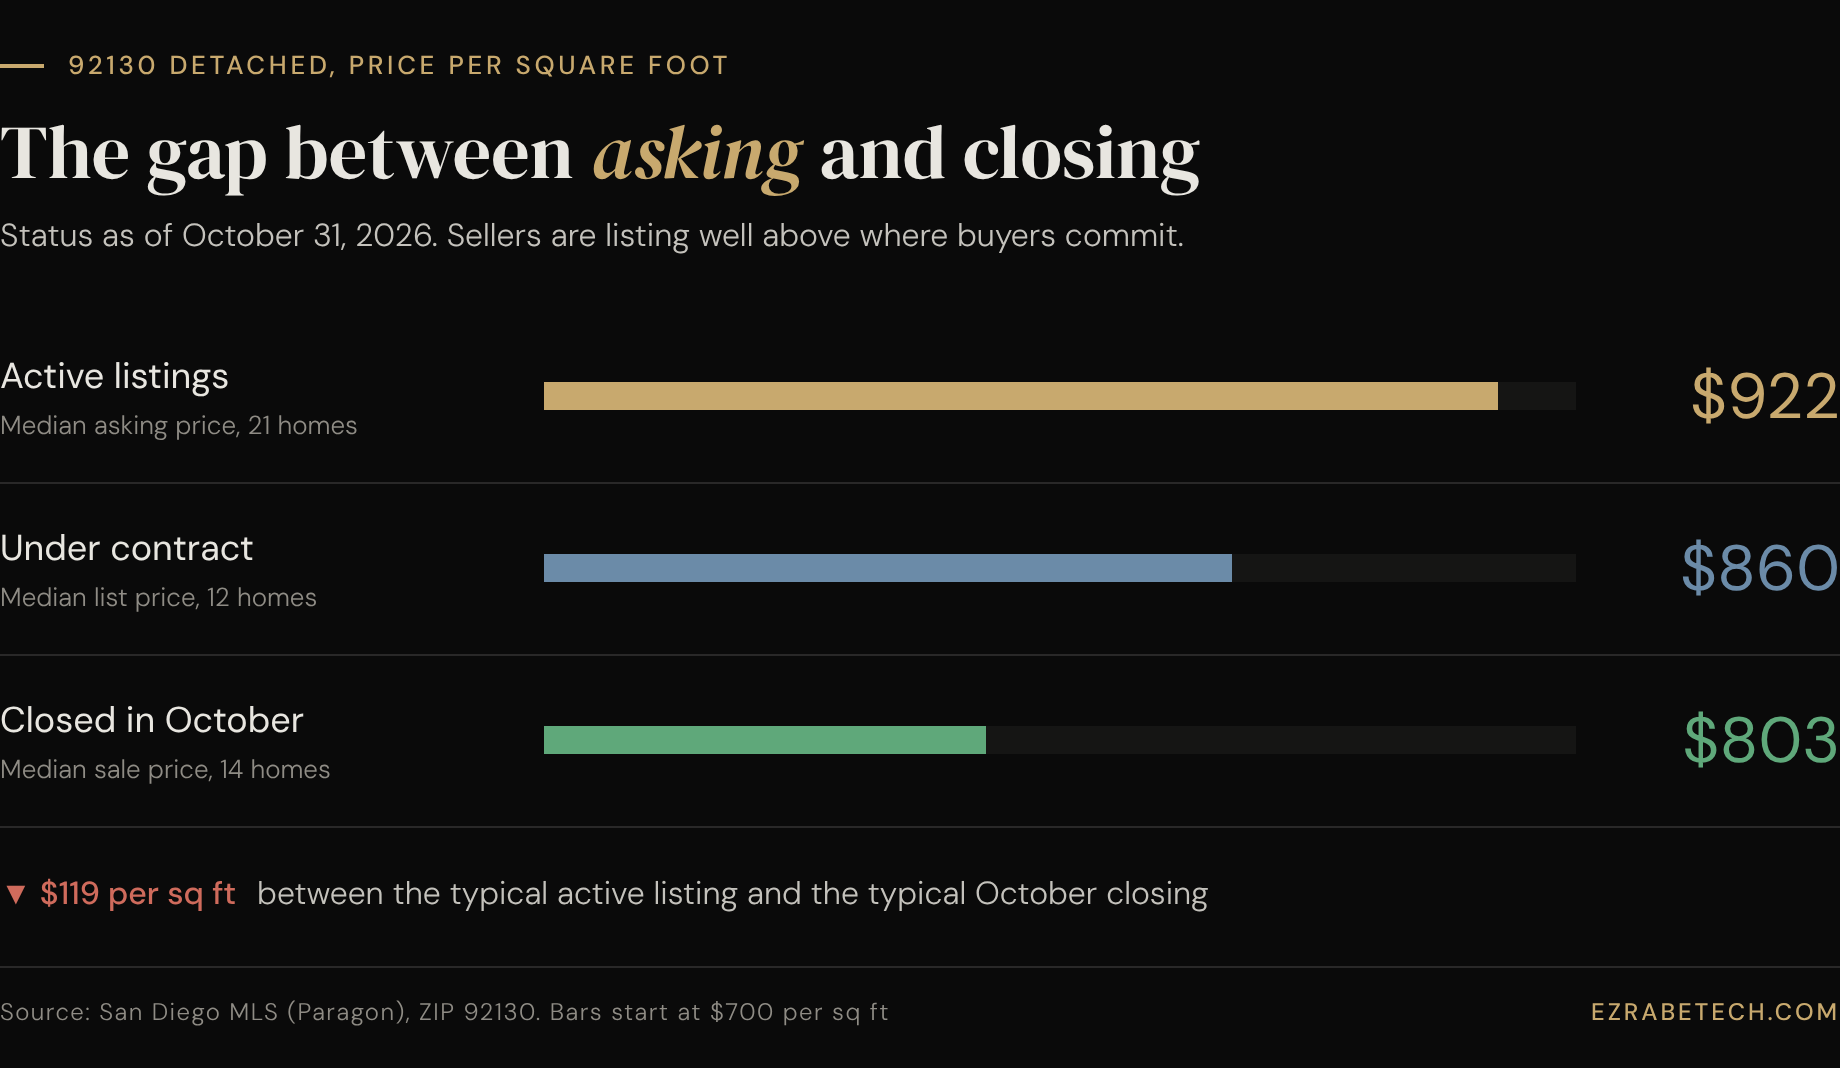
Active and pending figures use list price per square foot as of October 31, 2026. Closed figures use sale price. Bars start at $700 per square foot for legibility. Source: San Diego MLS (Paragon).
That is a gap of more than $100 per square foot between the typical active listing and the typical closing. Some of it is mix, but the direction is consistent: the homes going under contract are the ones priced closer to where sales are actually happening, and the listings asking well above that are the ones sitting. With 21 active detached homes against 14 sales in October, there is about a month and a half of supply at the current pace, which is still tight. Inventory isn't flooding the market. Buyers are simply declining to pay asking prices that ignore 7% mortgage rates.
Condos and townhomes took the bigger hit
Total 92130 sales fell from 38 last October to 22 this October, down 42%, and most of that drop came from attached homes. Condo and townhome sales fell from 21 to 8. Their median price per square foot slipped from $801 to $761, about 5% lower, and the median time from listing to contract more than doubled, from 25 days to 55. That fits the rate story. Attached buyers are more likely to be first time or move up buyers financing a large share of the purchase, which makes them the most sensitive to a rate above 7%.
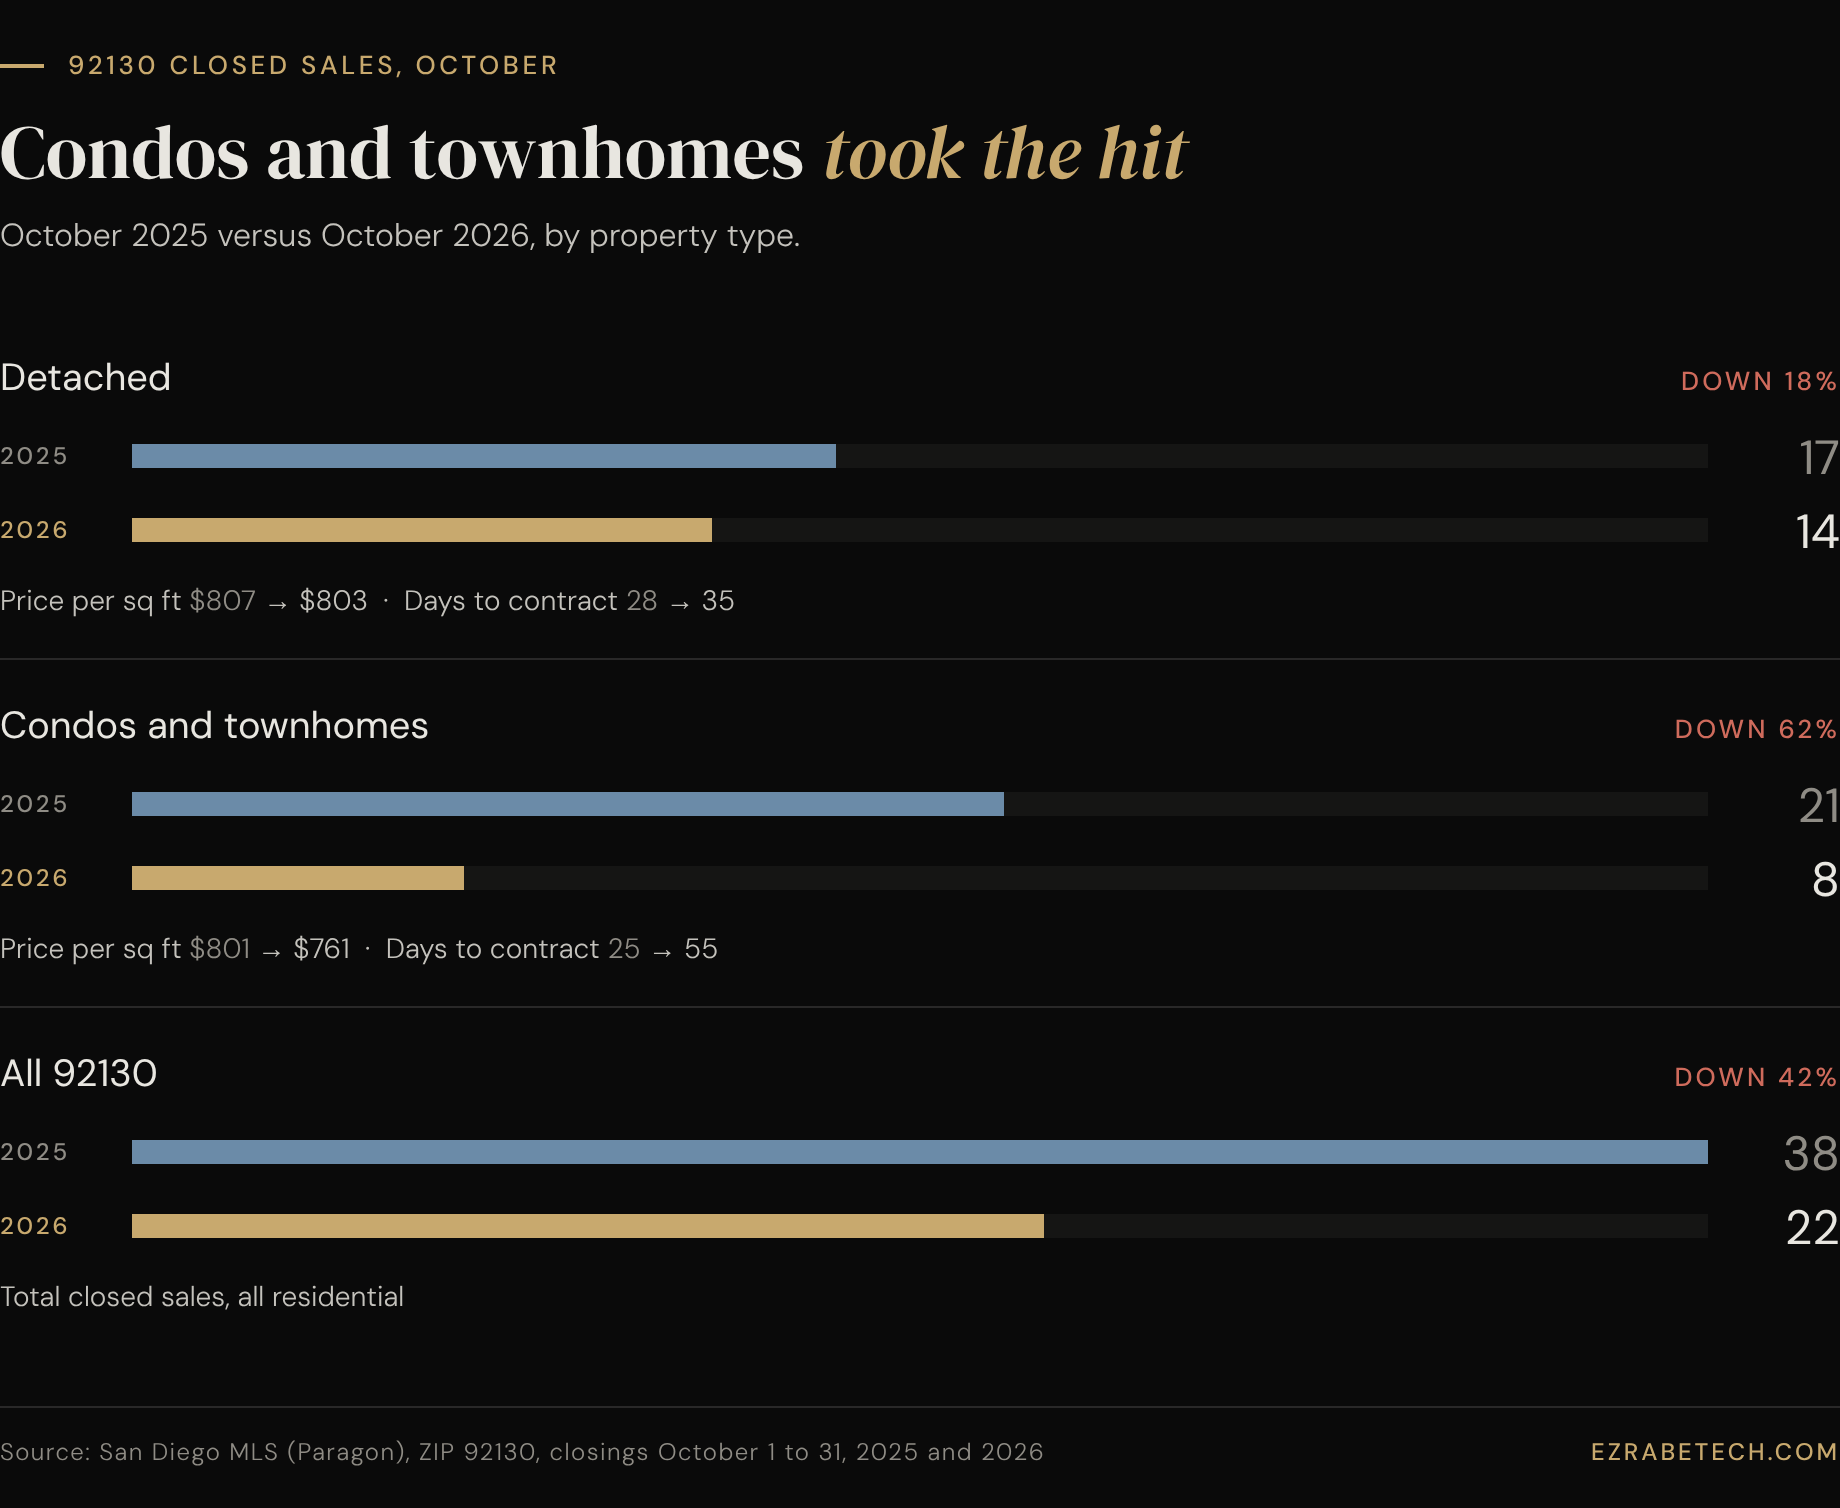
Attached homes accounted for most of the drop in volume, and the only meaningful decline in price per square foot. Source: San Diego MLS (Paragon), all residential closings in 92130, October 1 to 31 of each year.
The month's largest sale, and how it got there
The biggest sale in 92130 in October doesn't appear in the MLS figures above. 5146 Rancho Verde Trail closed October 5 at $6,125,000 according to public records, but its listing was removed from the MLS on October 17 without being reported as sold, so it isn't counted in the stats. Its path tells the same story as the rest of the month: listed in February at $6,995,000, reduced to $6,499,000 in June, and sold roughly seven months after it first hit the market at 12% below its original price.
The national backdrop
For the current read on Treasury yields and mortgage rates, see Treasury Yields and Mortgage Rates: What's Moving Them Now, which I keep updated.
The pressure on 92130 is coming from borrowing costs, and October gave buyers little relief.
October in numbers
- The Fed is hiking, not cutting. The Fed raised its benchmark rate a quarter point to 3.75% to 4.00% on September 16, its first increase since 2023. On October 28 it held, but two officials, Governor Lisa Cook and Cleveland Fed President Beth Hammack, voted for another hike, and the statement upgraded its description of growth to a strong pace. Futures markets priced about an 85% chance of a December hike after the meeting.
- Mortgage rates stayed above 7% all month. Freddie Mac's 30 year average ran from 7.28% on October 1 to a peak of 7.40% in mid October, the highest since late 2023, before easing to 7.24% on October 29. A year ago it was near 6.2%.
- The 10 year Treasury rallied late in the month. The 10 year yield started October at 5.29%, peaked at 5.31% on October 5, its highest close since at least mid August, and finished the month at 4.93%, down about 36 basis points. It's at 4.88% today.
- Energy is driving inflation. September CPI rose 0.6% for the month and 3.7% from a year ago, with gasoline up 34.2% year over year. Core inflation was steadier at 2.6%. Brent crude traded above $115 after an attack on a Saudi refinery the day of the Fed meeting.
- Growth is strong, hiring is not. Third quarter GDP grew at a 3.4% annualized pace, up from 2.2% in the second quarter. But September payrolls rose just 29,000, unemployment ticked up to 4.2%, and July and August were revised down a combined 60,000 jobs.
- San Diego County was already cooling heading into October. In September, the most recent month available, county home sales fell 6% from August and 12.2% from a year earlier, according to the California Association of Realtors, with the average price easing 3.7% to $1.05 million. October county figures are due later this month.
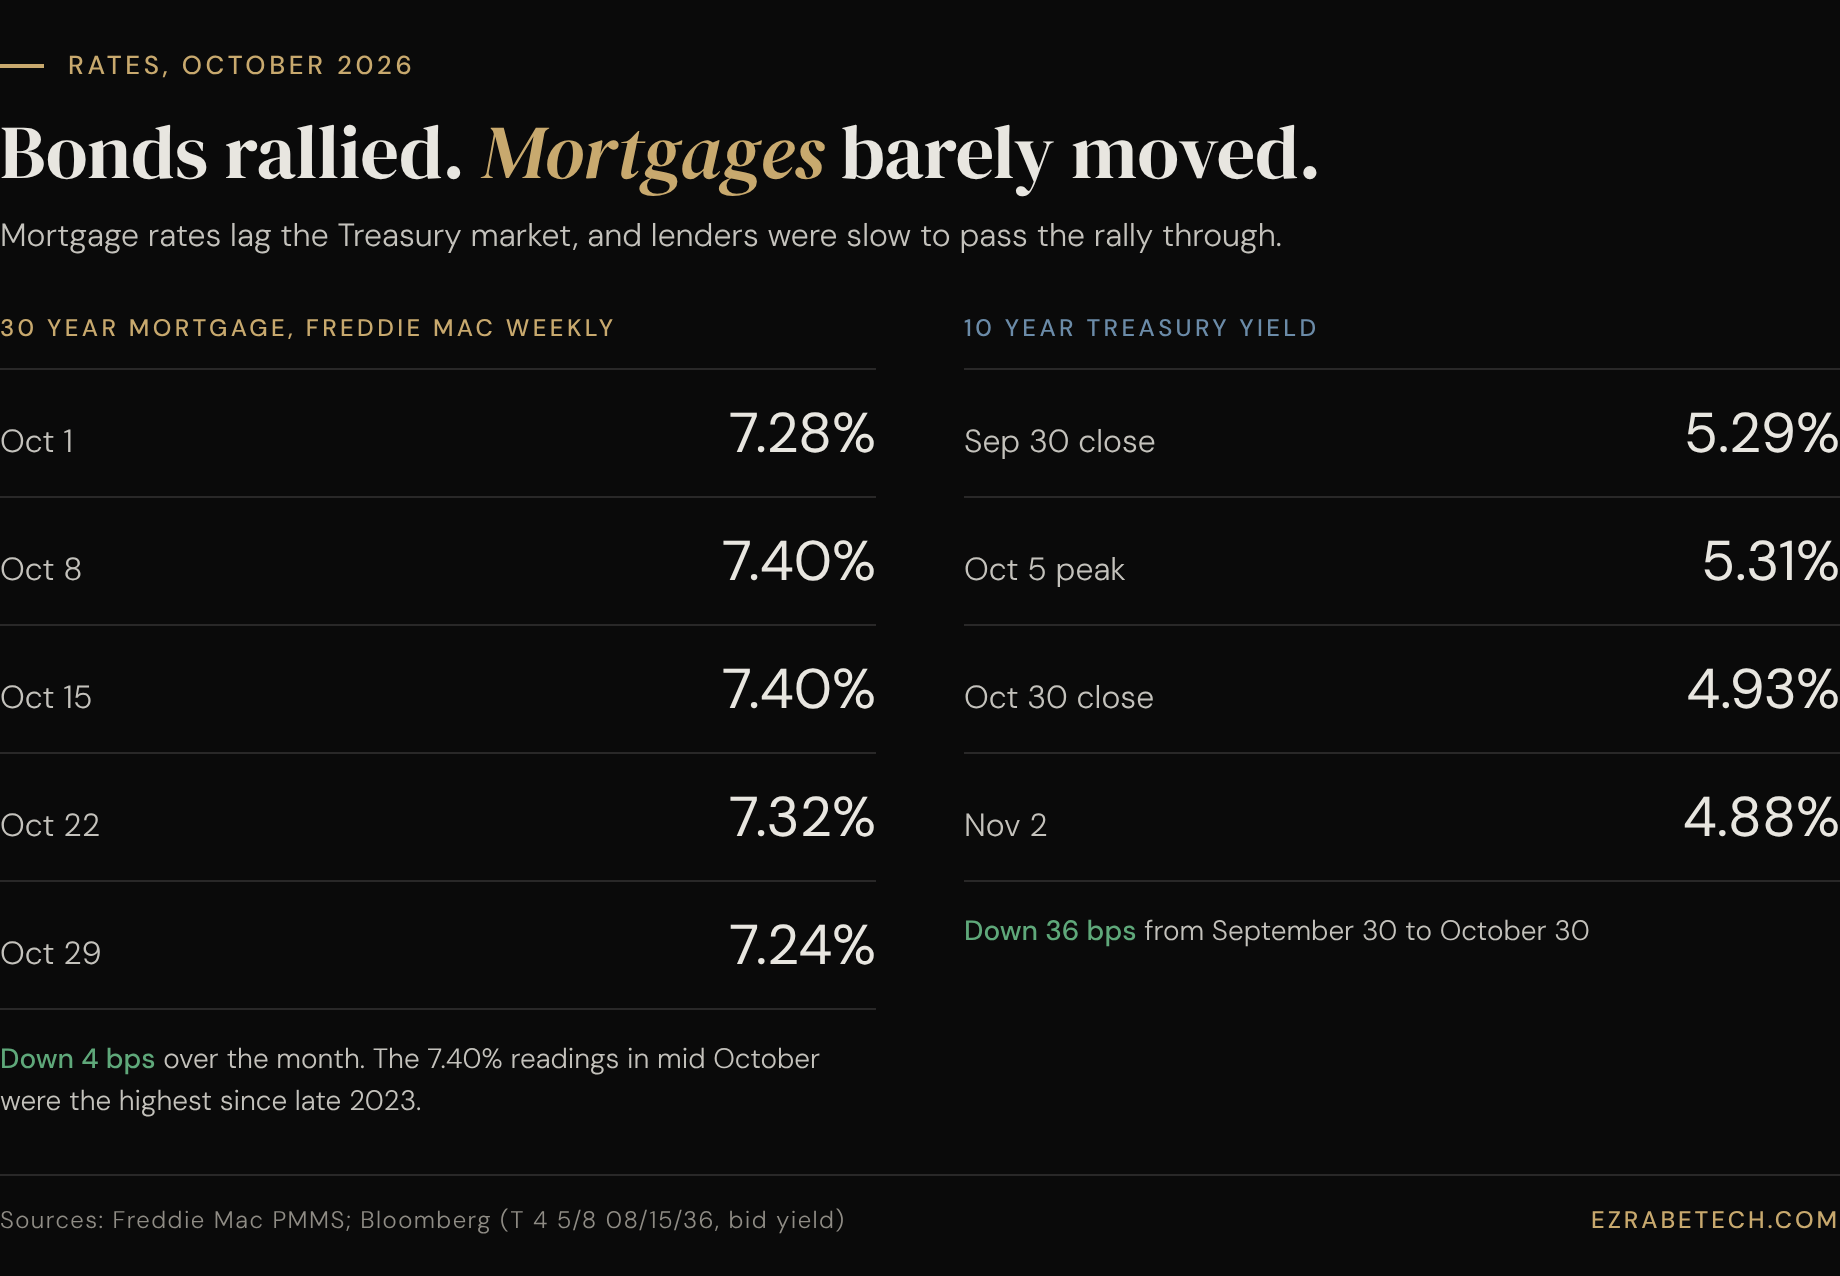
Mortgage rates lag the bond market. The 10 year fell 36 basis points over October while the weekly mortgage average fell only 4. Sources: Freddie Mac Primary Mortgage Market Survey; Bloomberg, 10 year Treasury bid yield.
As a trader, the takeaway is that this is a rate environment driven by an energy shock and a strong economy, not one where a weak economy forces the Fed's hand. That combination keeps long term yields, and mortgage rates, elevated. On a $2.86 million home with 20% down, the difference between a 6.2% and a 7.2% rate is roughly $1,600 a month in principal and interest. That is the math behind the price cuts.
Freddie Mac's weekly average only fell from 7.28% to 7.24% over the same stretch the 10 year rallied, because mortgage rates lag the bond market and lenders have been slow to pass the rally through. If the 10 year holds below 5%, there is room for mortgage rates to drift lower in November, though a December Fed hike would put that at risk.
What it means for buyers and sellers
For sellers, the market is still paying fair value, but only for homes priced to it. October's closings landed around $800 per square foot, and listings asking far above that are the ones collecting days on market and eventual reductions. Pricing to the closing data from day one will likely get you a better result than starting high and cutting later.
For buyers, this is the most leverage the 92130 detached market has offered in some time. Half of recent sellers negotiated, and the gap between asking and closing prices gives room to make offers based on the data rather than on list price. The tradeoff is the rate. Locking in above 7% is expensive, and anyone buying now should plan on that being their rate for a while rather than counting on a quick refinance.
If you're weighing a move in Carmel Valley, La Jolla, Coronado, Del Mar, Rancho Santa Fe, or anywhere else in San Diego County, I'm happy to walk through what these numbers mean for your situation.
A note on method
Local figures come from my own pull of the San Diego MLS (Paragon) for ZIP code 92130, covering closings from October 1 to 31 in 2025 and 2026, and listing status as of October 31, 2026. Detached and attached homes are reported separately. Days to contract are measured from the original list date to the pending date. One October sale recorded in public records but not reported as sold on the MLS (5146 Rancho Verde Trail) is described in the text but excluded from the figures.